
Geek Out With Us On Mah Jongg Statistics
As we turn the page on 2022, this is the perfect time to take a peek at some statistical highlights of our Mah Jongg year.
We set about analyzing every game played on ilovemahj.com, using the National Mah Jongg League's 2022 card, in the hope of discovering some interesting trends.
We were keen to answer the following questions:
- What proportion of games end in Mah Jongg vs wall games?
- On average, how many tiles remain in the wall at the end of a game?
- How long do players take to make decisions?
- What are the most popular hands on the card?
- How much influence do jokers have on the outcome of a game?
We delve into all of this and more... We hope you enjoy geeking out on these stats with us!
MAHJ vs WALL
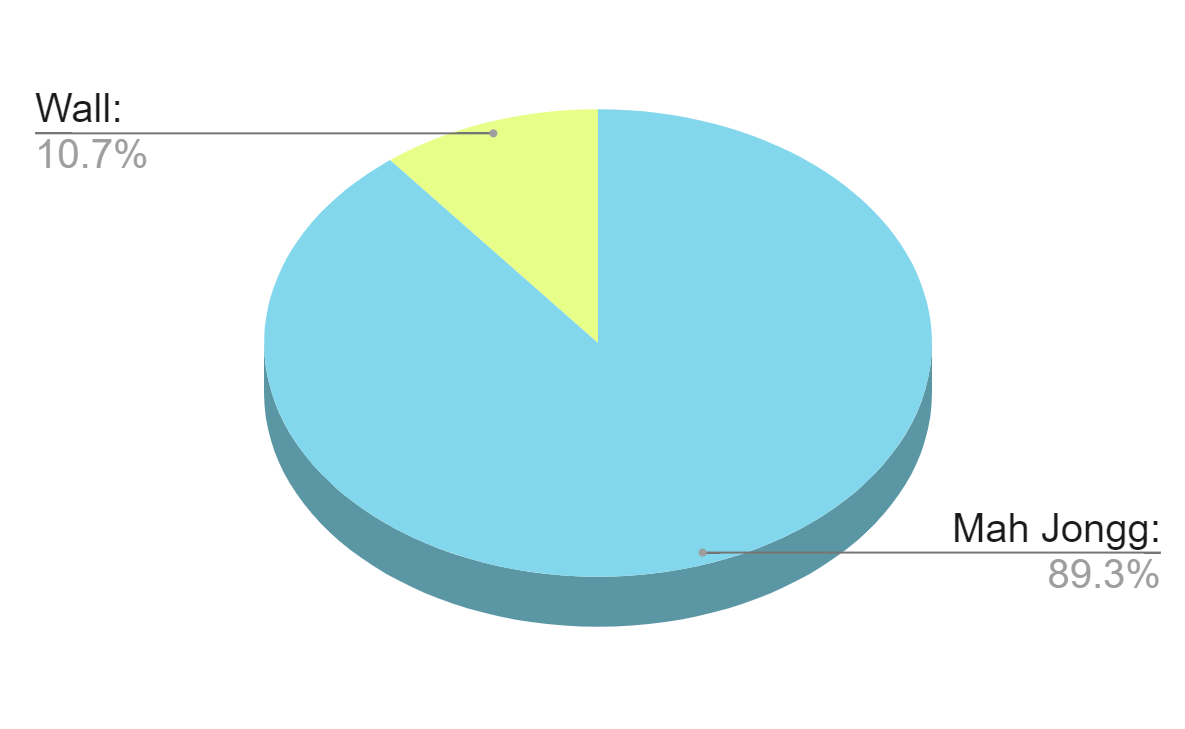
The first data point we looked at is how often games end in a win vs a wall game. Here are the results:
- Mah Jongg: 89.3%
- Wall: 10.7%
From here, we can calculate another interesting statistic: a player's expected win rate.
If you're playing against equally-skilled players, you'd expect to win 25% of the games that end in a win. Since 89.3% of the games end with a win, your overall expected win rate would be around 22.3%. So, check your Game Stats page! If your win rate is higher than this, you're doing great; maybe it's time to move to the next bot level or seek out more challenging tablemates 😉
We receive lots of messages from members of I Love Mahj and, occasionally, a player will write to ask for advice as they feel they're not playing as well as others. In this case, we always refer them to their Game Stats page, as this is the key to measuring performance. More often than not, these players are doing way better than they think!
So, we'd definitely recommend checking your win rate on ilovemahj.com to see how you compare (it's the blue portion of the pie chart). If your win rate is less than 22.3%, then perhaps it's time to take a look at our Exercise Room. Our exercises are designed to help you learn the card more thoroughly and build your Mah Jongg skills. Many of our members have seen tremendous improvement in their game by doing these exercises.
Keep in mind that Mah Jongg is partially a game of luck, so your win rate will fluctuate from day to day, but statistically should average out over time. The more games you've played on I Love Mahj, the more statistically accurate your game stats will be.
REMAINING WALL TILES
We also examined the number of tiles remaining in the wall (for games that ended in Mah Jongg). The average is around 35 tiles. Here's the distribution, showing the percentage of games won (Y axis) for each number of tiles remaining (X axis).

We can see from the chart above that the distribution follows mostly a bell curve.
If we were to include all games in our calculation (adding in wall games, where 0 tiles remain), the average number of tiles remaining in the wall at the end of a game would be 31.
From the average number of remaining tiles (31), we can determine another interesting stat: how many jokers we should receive per game.
A common complaint we hear is "I don't get enough jokers". This complaint is even more prevalent when playing with bots. Players typically tell us "the bots get all the jokers", referring to "the bots" collectively, and seemingly forgetting that there are 3 of them, so it would be expected that they would receive 3 times more jokers. Additionally, the frustration of having no jokers in a hand often causes us to recall similar times, and totally forget the games where we were "lucky" and received 5 or 6!
As there are 8 jokers in a set, if all games were played until no tiles remain, each player would expect to receive 2 jokers per game. However, as we've calculated that, on average, 31 tiles remain in the wall, this translates to around 80% of tiles being received (31/152 = 20% not received). With this being the case, on average, we should expect to receive around 1.6 jokers per game (80% of 2 jokers).
So, next time you feel cursed by the joker gods, head over to your Game Stats page on ilovemahj.com and we suspect you'll find that you've actually received your fair share (assuming you've played enough games on the platform for your average to be statistically meaningful).
Oh, and let's not forget the swapped jokers. You should expect 0.5 per game, on average.
THINK TIME
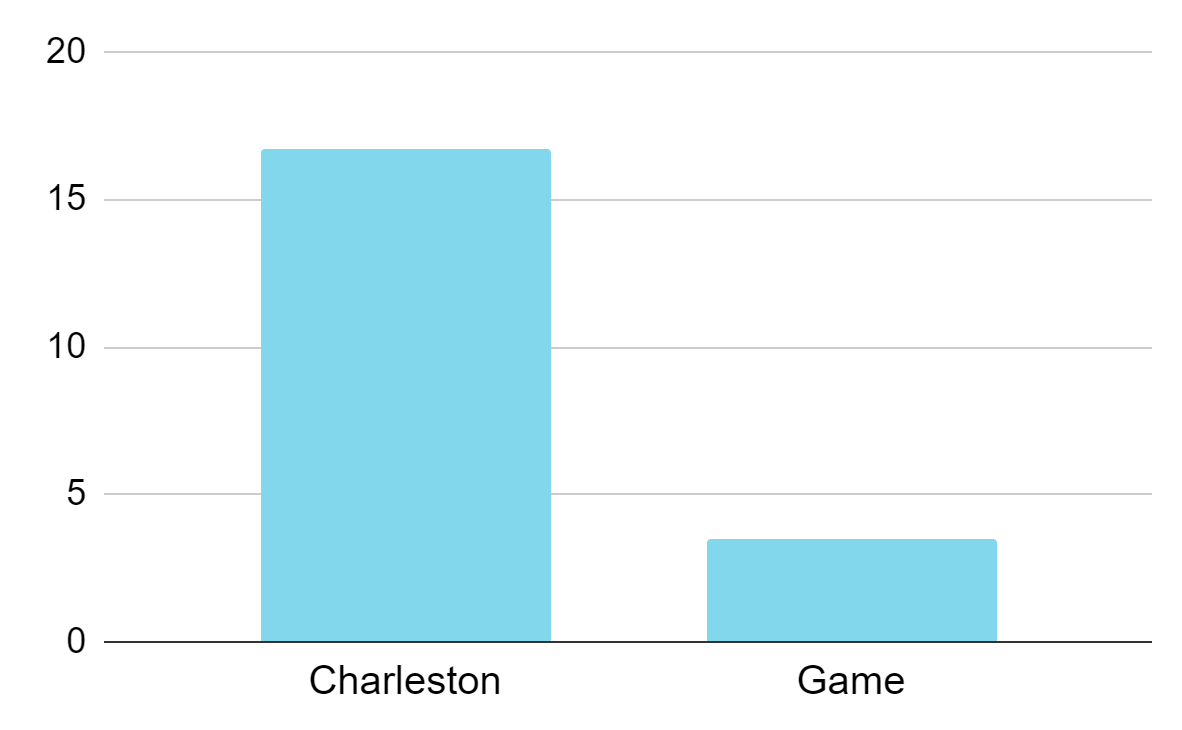
So, how long does it take a player to make decisions in both the Charleston and game? On average, players take:
- 16.7 seconds per decision in the Charleston
- 3.5 seconds per decision in the game
What's your average think time? Check your Game Stats (middle column) to find out.
Obviously, if you're a beginner, you may be slower than these numbers, and that's OK. As you learn the card better, you'll get faster. Practicing the "Make a Hand" and "What Hand is That?" exercises will help you learn the card more thoroughly, and the "Charleston Practice" exercise will help you make faster hand decisions. Head over to the Exercise Room to start practicing.
HAND POPULARITY
So, what's the most popular hand on the NMJL 2022 card? By far, Consecutive Run line 5 (in both one and two suits) is the most popular hand, which makes sense due to its flexibility. Unsurprisingly, 2022 line 5 (the "Big Hand") has been the least popular!
Below, we've listed all the hands, from most popular to least popular (includes both human and bot wins). The letters a and b in the line number represent the first or second version of a hand, respectively.
Most Popular Hands - Humans and Bots
| Hand | Popularity | Points |
|---|---|---|
| Consecutive Run, Line 5b | 12.18% | 25 |
| Consecutive Run, Line 5a | 7.07% | 25 |
| Consecutive Run, Line 7 | 5.80% | 25 |
| Any Like Numbers, Line 2 | 4.86% | 25 |
| Winds & Dragons, Line 6 | 4.76% | 25 |
| Winds & Dragons, Line 5 | 4.51% | 25 |
| 2468, Line 3a | 4.09% | 25 |
| 13579, Line 4 | 3.93% | 25 |
| Consecutive Run, Line 4 | 3.39% | 25 |
| Any Like Numbers, Line 1 | 3.33% | 25 |
| Any Like Numbers, Line 3 | 2.71% | 25 |
| 13579, Line 3b | 2.53% | 25 |
| Winds & Dragons, Line 4 | 2.49% | 30 |
| Consecutive Run, Line 3b | 2.23% | 25 |
| Consecutive Run, Line 3a | 2.23% | 25 |
| Consecutive Run, Line 2 | 2.16% | 25 |
| 2468, Line 3b | 2.05% | 25 |
| 13579, Line 3a | 2.04% | 25 |
| 369, Line 2b | 1.92% | 25 |
| 369, Line 1 | 1.46% | 25 |
| 2468, Line 1 | 1.43% | 25 |
| 13579, Line 5a | 1.40% | 25 |
| 13579, Line 5b | 1.34% | 25 |
| 369, Line 6 | 1.29% | 25 |
| Consecutive Run, Line 1a | 1.21% | 25 |
| Consecutive Run, Line 1b | 1.20% | 25 |
| 369, Line 2a | 1.19% | 25 |
| Winds & Dragons, Line 2 | 1.12% | 25 |
| 13579, Line 1a | 1.11% | 25 |
| 13579, Line 1b | 1.02% | 25 |
| Winds & Dragons, Line 3 | 0.99% | 25 |
| 2022, Line 2 | 0.88% | 30 |
| 369, Line 5 | 0.86% | 25 |
| 2468, Line 7 | 0.85% | 25 |
| 2468, Line 6 | 0.77% | 25 |
| 2468, Line 5b | 0.77% | 25 |
| 2468, Line 2 | 0.75% | 30 |
| 2468, Line 5a | 0.60% | 25 |
| Winds & Dragons, Line 1 | 0.59% | 25 |
| 369, Line 4 | 0.49% | 25 |
| 369, Line 3 | 0.45% | 25 |
| 2022, Line 3 | 0.42% | 30 |
| Consecutive Run, Line 6 | 0.41% | 30 |
| 13579, Line 6a | 0.39% | 25 |
| 13579, Line 6b | 0.37% | 25 |
| 13579, Line 2b | 0.35% | 25 |
| Quints, Line 1 | 0.34% | 40 |
| 13579, Line 2a | 0.32% | 25 |
| Winds & Dragons, Line 7 | 0.29% | 30 |
| 2468, Line 8 | 0.15% | 30 |
| 2468, Line 4 | 0.15% | 30 |
| Consecutive Run, Line 8 | 0.14% | 30 |
| Quints, Line 4 | 0.12% | 45 |
| 2022, Line 1 | 0.11% | 25 |
| 13579, Line 7 | 0.10% | 30 |
| 369, Line 7 | 0.07% | 30 |
| Quints, Line 2 | 0.04% | 40 |
| 2022, Line 4 | 0.03% | 30 |
| Singles & Pairs, Line 4 | 0.03% | 50 |
| Singles & Pairs, Line 5 | 0.02% | 50 |
| Singles & Pairs, Line 3 | 0.02% | 50 |
| Quints, Line 3 | 0.02% | 45 |
| Singles & Pairs, Line 6 | 0.01% | 50 |
| Singles & Pairs, Line 2 | 0.01% | 50 |
| Singles & Pairs, Line 1 | 0.01% | 50 |
| 2022, Line 5 | 0.0001% | 85 |
This brings up an interesting discussion. If you consider the percentage of each hand as a guide to how easy that particular hand is to complete, we see that there's quite a difference between hands. In theory, hands on the card that have been allocated the same points, should be of equal difficulty. But, for instance:
- Consecutive Run, Line 5 and 13579, Line 2 are both 25-point hands, but represent ~19% and ~0.7% respectively.
- Also, if we look at concealed hands, which appear to be played at least 10x less often, we could surmise that they are 10x more difficult, yet they are only worth 5 extra points.
- Another interesting case is Winds & Dragons, Line 4, which is 30 points, but appears to be a lot easier than many of the 25-point hands.
One could argue that the popularity of a hand does not necessarily represent its difficulty, as human players have biases towards certain hands they like, and sections they feel more "comfortable" with. And indeed, this seems to be the case. If we look only at hands won by humans, we see a slightly different distribution.
Top 15 hands - Humans Only
| Hand | Popularity | Points |
|---|---|---|
| Consecutive Run, Line 7 | 9.99% | 25 |
| Any Like Numbers, Line 2 | 6.15% | 25 |
| Consecutive Run, Line 5a | 5.44% | 25 |
| Winds & Dragons, Line 4 | 5.27% | 30 |
| Any Like Numbers, Line 1 | 4.79% | 25 |
| Consecutive Run, Line 3a | 4.76% | 25 |
| Consecutive Run, Line 5b | 3.74% | 25 |
| Winds & Dragons, Line 6 | 3.53% | 25 |
| 2468, Line 1 | 3.03% | 25 |
| Winds & Dragons, Line 5 | 3.02% | 25 |
| Consecutive Run, Line 1b | 3.01% | 25 |
| Consecutive Run, Line 1a | 2.69% | 25 |
| 13579, Line 1a | 2.54% | 25 |
| Any Like Numbers, Line 3 | 2.38% | 25 |
| Consecutive Run, Line 4 | 2.27% | 25 |
Do you have a bias (perhaps uncouncious) towards certain hands or sections on the card? Check out your Game Stats page to see how many times you've completed each hand.
Bots, however, are not partial to any particular hand. They will play based on the tiles they receive, and are better at matching hands objectively, with no emotion, preferences or preconceived notions.
Since the data used to calculate the overall figures include an extremely large number of games played by bots, we believe that, for the purpose of this analysis, it seems fair to correlate hand frequency to difficulty.
Therefore, the data reveals a disparity between the points a hand is worth and the difficulty of actually making it. Our conclusion is that the National Mah Jongg League should consider assigning point values based on the probability that a hand can be completed. Let's take a simplified form of Roulette as an example. Bets can be placed on red or black (with a 50% chance of winning) and the payout is 1:1. Or you could place your bet on a number, in which case the payout would be 35:1. In other words, the payout is proportional to the probability of winning each option. In contrast, the point values on the NMJL's card appear to be out of whack compared to the likelihood of achieving each hand.
This analysis is certainly not meant to discourage players from attempting the more difficult hands. There's so much more excitement and sheer joy when one completes a singles and pairs hand, or even a concealed hand, compared to a run-of-the-mill consecutive run. If the tiles lead you towards a more difficult hand, by all means go for it. We find it's way more fun to challenge ourselves when the opportunity arises.
But, you may want to consider this statistical analysis when playing in tournaments, or for money!
THE INFLUENCE OF JOKERS
Finally, we analyzed the outcome, based on how many jokers a player receives throughout the game.
Joker Effect on Game Results
| Jokers received | Outcome | Percentage |
|---|---|---|
| 0 | Loss | 90.2% |
| Win | 4.6% | |
| Wall | 5.2% | |
| 1 | Loss | 78.2% |
| Win | 13.2% | |
| Wall | 8.6% | |
| 2 | Loss | 61.0% |
| Win | 27.0% | |
| Wall | 12.0% | |
| 3 | Loss | 43.8% |
| Win | 41.1% | |
| Wall | 15.0% | |
| 4 | Loss | 29.9% |
| Win | 51.4% | |
| Wall | 18.7% | |
| 5 | Loss | 20.1% |
| Win | 55.7% | |
| Wall | 24.2% | |
| 6 | Loss | 13.4% |
| Win | 52.0% | |
| Wall | 34.5% | |
| 7 | Loss | 10.3% |
| Win | 46.6% | |
| Wall | 43.1% | |
| 8 | Win | 66.7% |
| Loss | 0% | |
| Wall | 33.3% |
Win percentage as a function of the number of jokers received

It should be noted that a player receiving 6+ jokers is relatively rare, so the data at the far right of the chart may not be statistically significant, hence the oddity in the chart. This could also be the result of the "paradox of choice", where the plethora of jokers opens too many options and the player misses the forest for the trees.
As expected, the more jokers we receive, the more likely we are to win (though not quite in a linear fashion). This confirms the fact that our favorite game has a large dose of luck thrown in. Perhaps too much so. What do you think? Is luck too much of a factor? Would you like to see skill and strategy taking a more dominant role? Let us know what you think by commenting on our Facebook Post or emailing us at info@ilovemahj.com. We'd love to hear your thoughts!
Also, if there are any other interesting Mahj statistics you'd like us to dig into, just let us know.
Mahj on, everyone!
Philippe & Julie
ilovemahj.com